
A risk committee opens its monthly pack to find three unrelated arrears figures, one from the loan management system, another from the finance ledger and a third from the collections platform. None of them is necessarily wrong; each is simply answering a slightly different question, using a different definition, a different cutoff or a different treatment of edge cases. But when a regulator asks for a single, evidenced figure, “it depends on the system” isn’t an acceptable answer.
For financial services firms, mismatches like these can delay board sign-off and leave senior managers accountable for the integrity of reported figures. Business intelligence (BI), built on a well-governed data foundation, is one way banks, building societies, insurers and fintechs can resolve that fragmentation and establish consistent, auditable figures that everyone can rely on.
What Is Business Intelligence in Financial Services?
Business intelligence in financial services is the use of data, analytics and reporting tools to turn financial, customer, risk and operational data into reliable information for decision-making. Banks, building societies, insurers and fintech companies use BI to monitor performance, manage risk, support regulatory reporting and understand customer outcomes.
Key Takeaways
- Business intelligence helps financial services firms turn fragmented data into consistent, trusted information for reporting, analysis and decision-making.
- Multiple use cases often rely on the same underlying data, so corrections and updates must flow through to every report and analysis it feeds.
- BI can support regulatory compliance by helping maintain data quality, establish lineage and provide evidence for reported figures and decisions.
Business Intelligence (BI) in Financial Services Explained
BI typically follows a simple chain: Combine data from multiple sources, apply rules to improve its quality and consistency, analyse it and then present it to the people who make decisions. A typical bank, for example, may have separate systems for current accounts, mortgages, cards, treasury, complaints and fraud, each holding different information about the same customer or product.
Bringing those data sources together can be difficult when systems are decades-old, use inconsistent business rules for classifying or calculating data or have been inherited through acquisitions. The same underlying data also may need to be applied in various ways for financial reporting, risk analysis, regulatory reporting or customer-outcome monitoring. Good BI, therefore, depends on integrating data, establishing clear rules for how figures are calculated, maintaining appropriate controls and being able to trace and reproduce the figures used in important reports and decisions.
Why Business Intelligence Matters in Financial Services
The financial services sector is very data-intensive, and firms rely on their data to back decisions regarding risk, finance, operations and customer outcomes. Prudential supervisors view data quality as important to firms’ safety and soundness, reflecting lessons from the 2007–08 financial crisis, when weaknesses in risk data aggregation and reporting made it harder for banks to identify exposures and concentrations and manage risks in a timely manner. In response, the Basel Committee developed the BCBS 239 principles to set standards for how banks gather, aggregate and report risk data; supervisors continue to scrutinise the largest global banks over fragmented IT and incomplete data lineage. The Prudential Regulation Authority (PRA) has imposed similar scrutiny through enforcement action against firms with weak reporting controls. For these types of critical reporting and analysis, BI can collate the required data.
Conduct regulation also requires firms to understand and provide evidence for customer outcomes. The FCA’s Consumer Duty, for example, requires firms to demonstrate good outcomes for retail customers, including vulnerable customers. BI brings together the data firms use to monitor customer outcomes, identify emerging issues and document how those issues are being addressed.
At the same time, fraud and operational resilience have become data problems with direct costs attached. Mandatory reimbursement rules split the cost of an eligible push payment fraud claim between the sending and receiving firm, while resilience rules require firms to map and test the systems behind each important business service, which is, at its core, a data exercise. Both depend on accurate, connected data about transactions, systems, processes and dependencies. That combined data can then support monitoring and analysis.
Benefits of BI in Financial Services
With the right data governance in place, BI can replace manually compiled, inconsistently defined figures with trusted, well-defined metrics and deliver them more quickly to the people who need them. For a board reviewing risk appetite, that would mean one trusted figure in time for the meeting; for a product team pricing a new account, it would mean getting updated margin data within days. Other benefits include the following:
- Better decision-making: Committees make better calls when every member works from the same figures. A shared data set ends debates over whose numbers or interpretations are right, so meetings can focus on what to do next.
- Faster management information: Automated data feeds can refresh reports daily, or even several times a day, depending on the underlying systems. Committees can access the most recent numbers and act on them sooner.
- Consistent KPIs: A governed BI environment can apply the same agreed KPI definition across reports. Using the same KPI definitions across reports also gives regulators and internal reviewers a clearer basis for assessing the data.
- Increased profitability: Product- or customer-level margins can be analysed in BI by combining funding, operating and capital costs. Firms can use the resulting insights to identify loss-making products, inform pricing decisions and focus investment where margins are strongest.
- Earlier risk signals: Spotting warning signs early, such as more borrowers missing a first payment or cash buffers shrinking, can give management more time to tighten lending criteria, adjust risk appetite or raise funding before losses grow.
- Stronger audit evidence: Auditors and regulators may ask two fundamental questions about a reported number: Where did it come from, and who checked it? A well-designed BI and data environment can capture lineage, approvals and other control evidence as data moves through the reporting process.
- Clearer customer insight: Product and interaction data from multiple systems can be combined in BI to create a consolidated view of the customer relationship. Firms can then group customers by attributes and compare their outcomes, helping to support Consumer Duty monitoring.
- More responsive planning: When reconciled results are readily available, finance teams can update forecasts throughout the year, rather than waiting for periodic reporting cycles. The same underlying data may also be fed into capital and liquidity stress tests to help firms run scenario plans using the latest information.
- Reduced errors and data consolidation: Copying data from one spreadsheet to another makes typing mistakes, broken formulas and inconsistent versions more likely. Automating data collection and reporting can remove many of those failure points.
Finance Futures: Tomorrow’s Vision

Financial Services BI Use Cases
BI can be particularly valuable in areas where individual teams and reporting processes rely on the same underlying data. Information about a single mortgage, for example, can contribute to a capital return, an arrears dashboard, a profitability analysis and a Consumer Duty review. When that data is governed and brought together in one place, using consistent definitions and controls, teams can work from the same figures. Then, if a correction is made in one place, the change flows through to every report. Here are some of the main ways UK firms put BI to work.
Regulatory Reporting
Regulatory returns require a high degree of accuracy and control. Banks submit detailed reports to the PRA on their capital, financial position and liquidity, while insurers file their own returns under Solvency UK, the UK’s prudential regime for insurers. BI supports this work through reconciliation dashboards that highlight differences between reported figures and source systems and variance checks that identify unusual movements for investigation. Data lineage helps firms trace reported figures back to their source data and transformations. Together, these controls make it easier to trace a regulatory figure to its source, investigate exceptions and document how the figure was produced.
Risk Monitoring
Risk monitoring helps firms track exposures, trends and breaches against the limits their boards have set for credit, market, liquidity and operational risk. For lenders, risk dashboards can display expected credit loss measures, lending concentrations by sector or region and indicators of changing credit risk, including outputs from statistical or machine-learning models, such as a borrower’s probability of default. When firms use these models, they should test and document them and monitor their performance over time.
Customer Outcomes
Under Consumer Duty, firms need to demonstrate that they are delivering good outcomes in four areas: products and services, price and value, consumer understanding, and consumer support, and monitor those outcomes for multiple customer segments. BI helps firms analyse the outcomes throughout the customer journey, using data such as applications, complaints and customer-service interactions. For products where pricing varies by customer tenure, firms can also contrast how much long-standing customers pay versus rates offered to new customers, then identify disparities in outcomes.
Fraud Detection
Real-time transaction scoring can use machine learning models, rules or other techniques to reach a quick decision on whether a payment should be released, held for review or stopped. The results of those individual decisions can then be monitored in BI, assessing, for example, the rate of confirmed fraud by typology, the rate of legitimate payments wrongly blocked, signs that an account is being used to move stolen funds, the cost of reimbursing victims and the backlog building up for investigators.
Profitability Analysis
Profitability analysis helps reveal where a firm makes and loses money, whether by product, customer, channel or another part of the business. Relevant funding, operating, capital and other costs can be allocated to products or customer groups to show their contribution to overall profitability. The analysis may also incorporate risk-adjusted measures so that higher returns can be considered alongside the risks and resources required to generate them.
Liquidity Planning
Liquidity planning assesses a firm’s ability to pay its bills under normal conditions and during periods of financial stress. Treasury dashboards can display contractual cash flows, behavioural deposit models, liquid asset positions and funding concentration by counterparty and currency to show how liquidity might change under a range of scenarios. The analysis can reveal potential liquidity shortfalls before treasury teams make funding decisions.
Operational Resilience
UK operational resilience rules require firms to identify their important business services, such as payments or insurance claims, and set an impact tolerance (the maximum tolerable disruption) for each one. Resilience dashboards can give firms a consolidated view of the people, systems, facilities and third parties supporting each service, as well as records of past outages, recovery times and disaster-recovery exercises. This information can be used to assess whether services remain within their impact tolerances and to identify dependencies that could create concentration risk. The critical-third-parties regime allows HM Treasury to designate suppliers, such as major cloud providers, whose disruption could pose a risk to the UK’s financial stability, making visibility of firms’ dependencies on major technology providers increasingly relevant to resilience monitoring.
Data Foundations and Governance for Financial Services BI
The quality of BI depends heavily on the “golden” or authoritative data sources, consistent definitions, lineage and controls underpinning its dashboards and reports. Fragmented IT and incomplete data can create inconsistencies, while manual processes are slow and liable to introduce errors. The following practices create the data foundation needed for effective BI:
- Source-system integration: Critical data elements should have a clearly identified authoritative source: a core banking platform for balances, the general ledger for financial positions, a collateral system for valuations and a master data hub for customer attributes, for instance. Capture data at the lowest possible level of granularity, such as at transaction or contract level, and aggregate it afterwards.
- Common data definitions: A shared glossary sets out exactly what terms like “customer”, “default” and “complaint” mean, as well as how to calculate their relevant KPIs. A semantic layer can then apply those definitions to every report. If regulators or accounting standards have already defined a term, firms should follow their lead.
- Data quality and reconciliation: Data quality can be measured across dimensions such as accuracy, completeness, consistency, timeliness and validity. Each dimension may have its own rules, such as “no duplicate customer IDs”, and data pipelines can test new data against those rules automatically. Reconciliation then helps confirm that totals match across all systems and reports, accompanied by a log entry and appropriate approval for manual adjustments.
- Data lineage and traceability: Lineage documents the path a number takes from a source system to a final report, tracing relevant transformations and manual steps along the way. Technical lineage can be harvested automatically from extract, transform and load (ETL) and BI system metadata, while business lineage explains in plain language which policy and control applies at each step. Together, they create an evidence trail showing where data originated, how it changed and which controls applied along the way.
- Role-based access controls: Access rights follow each person’s job role. A branch manager might see data for their own branch, with access to account numbers and vulnerability alerts limited to users with a legitimate need to see them. Firms should restrict access to sensitive customer details to staff actively helping those customers.
- Metric and dashboard ownership: Every key metric should have a named owner who can explain what it measures and why it moved. Assign an owner to every critical data source who will be responsible for its quality. Ideally, these ownership arrangements will align with the firm’s broader governance and accountability framework.
Areas Shaping BI in Finance
Advances in BI mean that a risk analyst can type a question in plain English and get an answer in seconds, while a single climate disclosure can draw on data from thousands of borrowers. For the most part, UK regulators have sought to apply existing accountability, governance and data protection expectations to these financial services industry trends, while introducing new requirements where needed:
- AI: Newer BI tools support chat interfaces backed by approved data, and some use financial services AI agents to carry out multi-step analyses on their own. AI models also support a number of use cases, such as fraud detection, customer churn and loan default protection, whose outputs can be fed straight into dashboards. More broadly, 75% of UK financial firms surveyed were using AI as of late 2024, up from 58% two years earlier. Regulators expect firms to apply appropriate governance and controls to AI models being used to inform business decisions.
- Cloud-based BI tools: Cloud data platforms and SaaS tools can scale computing capacity during month-end processing and stress-test runs without requiring a firm to own the underlying hardware. A small number of cloud providers host a large share of the sector’s workloads, and this concentration has become a regulatory concern under the UK’s critical-third-parties regime.
- Self-service analytics: Business users can build their own reports without waiting for a central data team. Without oversight, though, each user may end up calculating metrics differently, thus re-creating the problems of inconsistent KPIs that BI was supposed to solve in the first place. A tiered governance model can reserve certified data and dashboards for board and regulatory reporting while applying lighter review to lower-risk use cases.
- Sustainability reporting: New UK Sustainability Reporting Standards and the PRA’s climate risk expectations are increasing the need for reliable emissions and climate data alongside financial data. Financed emissions require firms to connect financial exposures with counterparties’ emissions data, using estimates and other approaches where direct data is unavailable, and to improve data quality over time.
BI Software for Financial Services
A financial services BI technology stack includes many types of software, from systems that store and integrate data to those used for analysis and reporting. The lines between these categories are blurring, however, as cloud vendors bundle more of them together:
- ERP systems: An ERP with financial management capabilities records the books through a general ledger. In a bank, an accounting hub may connect the ledger with card, lending, treasury and deposit systems, which can, in turn, transform large volumes of business events into journal entries, using centrally managed rules. This hub becomes the system of record with which every finance and regulatory figure should reconcile.
- BI dashboards: Dashboards and paginated reports provide teams and board members with interactive views, management and regulatory reports and scheduled alerts. In a regulated firm, capabilities such as row- and column-level security, certified-content workflows, audit logs of views and exports and a governed semantic layer that applies agreed-upon definitions can all support appropriate control of BI content.
- ETL platforms: ETL tools copy data out of source systems, convert it into a common format and load it into a data warehouse. Reports often depend on this integrated data, so regulated firms may test and approve changes to conversion rules and check record counts on loads to help prevent coding errors from affecting reported figures.
- Master data management (MDM) tools: MDM matches, merges and governs a single golden record for customers, counterparties, products and legal entities. This can provide a consistent foundation for a single customer view for Consumer Duty or a group exposure view for large-exposure limits, so those relationships don’t have to be re-created by hand in every report.
- Analytics platforms: Analytics platforms offer tools for analysing data and, in some cases, developing statistical or machine learning models for use cases, such as credit risk assessment, fraud detection and customer behaviour analysis. Depending on the platform, these tools may include coding environments and computing resources that can accommodate large data sets. Once a model goes live, its outputs can be incorporated into dashboards or other reporting tools. Model-monitoring tools can then track whether accuracy slips over time.
- Data warehouses and data lakes: A data warehouse holds integrated, historical and modelled data built for reporting and analysis and can support point-in-time reporting when historical data and transformations are retained appropriately. A data lake can store large volumes of raw data in a range of formats, including call transcripts, documents and system logs, all of which can be later used for analysis or to train machine learning models. Many firms now combine data lakes and warehouses, with data moving from raw storage through cleansing and standardisation before being made available for reporting.
How to Implement BI in Financial Services in 6 Steps
Trying to move data from every existing system before building a single report can take years and may strain leadership’s patience and the budget. Firms can begin by identifying the decisions that need the most support, then work backwards to the data and technology required to help. A BI implementation can then proceed in six steps:
- Start with priority decisions: List the types of decisions, reporting requirements and business questions that matter most and are hardest to support today, such as setting risk appetite limits or evidencing Consumer Duty outcomes, and rank them by value and regulatory exposure. For each one, write down who makes the decision, how often decisions are made, which committee receives the results, and what currently has a tendency to go wrong.
- Map data sources and owners: For each priority area, identify the sources used to produce the relevant figures and the people responsible for those data sources. Note whether the data arrives automatically or through manual processes, along with any known quality problems. Identify personal or sensitive data and establish appropriate access controls before it is made available through dashboards.
- Agree KPI definitions: Bring together the people responsible for each priority area and agree, in writing, on the formula, level of detail, source and threshold for every relevant KPI. Record those definitions in a shared glossary to reduce the risk of drift between reports.
- Build controls into the data flow: Design each pipeline to capture the evidence that supports reporting and control processes. Automated completeness checks, general ledger reconciliation, logs of manual adjustments and role-based access controls can all contribute to a stronger control environment and to clearer audit evidence.
- Pilot with end users: Build a working dashboard for one or two of the priority areas from step one, with the controls from step four already in place, and agree on how success will be measured before it goes live. Test it with the people who will use the output in their normal reporting or decision-making processes for at least one full reporting cycle, then gather feedback on whether it met their information needs.
- Measure value and scale: Review the pilot against its success metrics: board-pack production time, the number of reconciliation breaks, the share of work still done manually and earlier detection of problems, such as rising arrears. If the pilot reduces reporting time, reconciliation breaks or manual work, extend the approach to other reports and use cases.
Connect Financial and Operational Data with NetSuite
When financial, risk and customer data are dispersed throughout disconnected systems and spreadsheets, reporting takes longer to produce and is harder to validate. NetSuite ERP Software for Financial Services provides a cloud platform for financial management and operational data, with capabilities for accounting, multi-entity consolidation, reporting and compliance. Real-time dashboards and reporting can bring current financial and operational measures into a single view for finance teams, while role-based access, segregation of duties and comprehensive audit trails support stronger controls and audit readiness. Where supported by the deployed product and configuration, AI-assisted capabilities may automate parts of reconciliation and identify anomalous transactions for review.
NetSuite Financial Performance Dashboard with KPIs and Trends
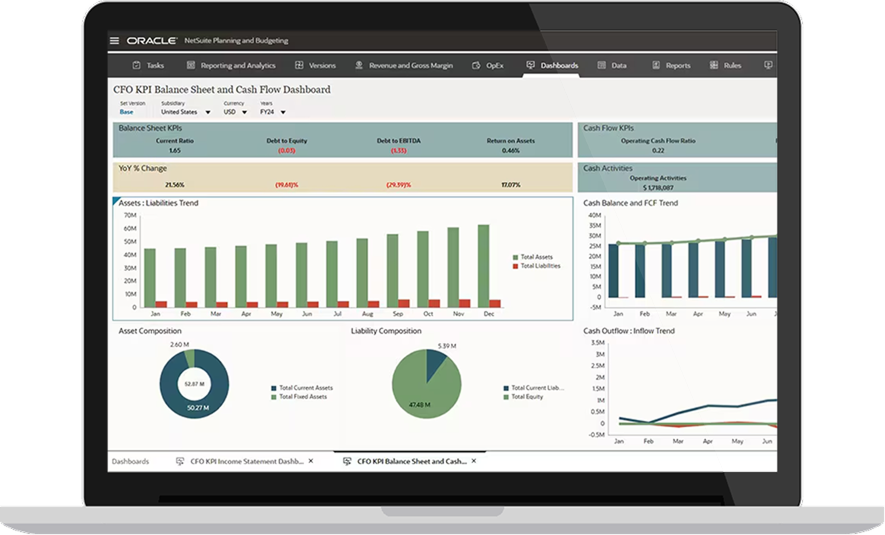
For financial services firms, the value of BI depends less on producing more dashboards than on making important figures traceable, reconciled and usable when decisions need to be made. Firms are more likely to realise value from BI when reliable data sources, shared definitions and appropriate access controls are established early. As AI tools and cloud platforms bring more data into regulated decisions, firms should be prepared to explain where important figures came from, how they were calculated and what controls were applied, potentially at short notice.
Business Intelligence in Financial Services FAQs
What is business intelligence in finance?
Business intelligence in finance is the data processes and governed platforms that turn transaction and risk data into information a firm can act on and use as evidence to satisfy a regulator. In regulated firms, that information also must be accurate, complete, timely and traceable enough to satisfy supervisors and auditors.
What is the difference between financial intelligence and business intelligence?
Business intelligence is the broader capability of turning organisational data into information for reporting, analysis and decision-making. Financial intelligence may refer either to analysis of financial information, or, in a regulatory context, to intelligence relating to suspected financial crime.
What are the 6 elements of business intelligence?
Six essential elements of business intelligence include data sources, data integration, data warehousing, data analysis, reporting and visualisation and governance and security.
What are the 5 stages of business intelligence?
Although there’s no standard five-stage model for BI, a typical process involves data sourcing, data analysis, situation awareness, risk assessment and decision support. Together, they describe how a single piece of raw data moves from a source system to become information a decision-making committee can act on.