
A wealth management firm can stay busy without growing. Even if client meetings and portfolio reviews fill the calendar and quarterly statements go out on schedule, none of that work confirms whether the business is bringing in new assets, retaining clients or even making money on those relationships. Key performance indicators (KPIs) turn day-to-day activity into measurable numbers covering growth, client retention and profitability. Here’s why the following 15 KPIs are the ones worth building into a regular review.
Key Takeaways
- A KPI becomes useful once it’s tied to a specific objective, a set time period and a named owner who is expected to act on what it shows.
- Growth KPIs, such as net new assets (NNA) and total assets under management (AUM), show whether new business is outpacing what a firm loses to withdrawals, market movement and client attrition.
- Profitability KPIs, including net profit per advisor and net profit per client, reveal which relationships and which advisors are generating margin.
- Client retention rate, net promoter score (NPS) and referral rate together show how well a firm holds onto clients and inspires them to become company advocates.
- Centralising KPI tracking in one system makes it easier to notice trends before they show up as decreased profits or lost clients.
What Are the Components for a Great Wealth Management KPI?
A metric is any number a firm can measure. A KPI is that number tied to a specific objective, a set time period, an established review cadence and a named owner responsible for acting on what the figures show. For example, assets under management (AUM) reported as a standalone figure, for example, “AUM reached £400 million this quarter”, is a metric. But AUM tracked against a growth target, reviewed monthly by a named practice manager and read alongside net new assets (NNA) to see whether the growth is sustainable or just market movement, is a KPI. Firms that report metrics without that structure often end up with a lot of data that is rarely acted on.
Finance Futures: Tomorrow’s Vision

15 KPIs for Wealth Management Firms
Regularly reporting on the following 15 KPIs gives managers of wealth management firms a broad view of how the company’s performance contributes to success. Some measure growth, some profitability and others how effectively the firm is retaining and serving clients.
-
Total Assets Under Management (AUM)
Total AUM is the combined value of client assets under a firm’s management or advisory services. It’s a core measure of an asset-based wealth management firm’s size and, in businesses where fees are charged based on a percentage of assets managed, it is directly related to revenue. Evaluated alongside NNA and market performance, it shows whether changes in the asset base result from client inflows and outflows, market movements or both.
-
Net New Assets (NNA)
NNA refers to the money moving into a firm’s accounts from new and existing clients, minus withdrawals, distributions and closed accounts. Though positive NNA is important, firms need to analyse the source of assets, such as new clients, existing-client inflows or organic growth, because each source reflects a different growth driver, acquisition cost and client relationship strength measure. New-client inflows, for example, could indicate effective prospecting and referrals, while new investments from existing clients might demonstrate successful relationship-building and client retention.
-
Total Revenue
Total revenue measures the income generated from advisory fees, discretionary management fees, commissions and other chargeable services. While the headline figure shows the overall size and direction of income, it doesn’t show where it comes from. Tracking each revenue stream separately shows the source of growth or where it’s declining. For instance, total revenue can remain stable or grow at the same time an important revenue stream is shrinking if another source makes up the difference.
-
Revenue Growth Rate
Revenue growth rate compares total revenue between two periods, typically year-on-year. It can expose issues such as fee compression: A firm’s assets can grow while revenue stays flat (or even falls) if average fees decline faster than the asset base increases. However, revenue changes can also reflect differences in the types of clients, assets and services the firm supports, as well as one-off income or acquisitions. Compare revenue growth with AUM growth to assess whether a change reflects sustainable, underlying business growth.
-
Net New Clients
Net new clients is the number of new client relationships opened during a period, minus those lost. Whereas NNA is measured in pounds, the net new clients KPI counts relationships. Comparing the two helps management see whether asset growth is spread among many client relationships or concentrated in a small number of large clients. For example, strong NNA alongside flat net new client numbers suggests that a small number of large relationships may be driving growth. That may be intentional, but it creates a different client concentration profile from a firm adding many smaller relationships.
-
Client Growth Rate
Client growth rate measures the percentage change in total client count over a period. It adds context to net new clients by showing its significance relative to the firm’s starting client base. For instance, adding 100 clients represents 20% growth for a firm starting with 500 clients, but only 1% growth for one with 10,000. Consider client growth rate alongside operating capacity, since rapid growth can put pressure on onboarding, advisors, support teams and compliance processes. In general, growth is valuable only if the firm can maintain service quality, manage risk and control costs as its client base expands.
-
Client Retention Rate
Client retention rate is the percentage of clients a firm keeps over a given period, usually measured annually. In wealth management, retention has a direct financial consequence. Losing a client can mean losing the associated assets and the future revenue those assets would have generated; a declining retention rate can provide early warning of financial pressure. Segmenting retention by advisor, client type, tenure or service model can also reveal whether losses are concentrated in a particular part of the business.
-
Net Promoter Score (NPS)
NPS measures how likely clients are to recommend a firm, usually through a short survey. It’s more useful as a trend and diagnostic tool than anything else: The score matters most when it is tracked consistently to identify what drives changes rather than as a definitive measure of loyalty or service quality. A falling score should prompt management to examine feedback, complaints, service issues and client segments driving the change. It’s also worth comparing NPS with referral activity. Clients might say they’re willing to recommend the firm but never generate a single introduction, suggesting a potential mismatch between client advocacy and the firm’s referral process.
-
Referral Rate
Referral rate measures the proportion of new clients acquired through recommendations from existing clients versus marketing, business development or other channels. It shows how much new business the existing client base generates, and tracking it by advisor or team can identify meaningful differences in performance. This can help management investigate the strength of advisor relationships and referral-request practices, or survey how effectively referred prospects are converted into clients.
-
AUM Per Advisor
AUM per advisor divides total AUM by advisor headcount to calculate the average assets each advisor is responsible for. It can help a firm assess staffing and capacity, but it can’t measure individual advisor performance. The figure can rise when market growth increases asset values or because a few large clients have joined the firm. Consider it alongside client numbers and service standards to determine whether advisors can maintain high-quality service even as their responsibilities grow.
-
Time Spent on Each Client
Time spent on each client refers to the advisor and support staff hours required to service a relationship. This includes meetings, reviews, reporting and ad hoc requests. The purpose is to understand whether the amount of service delivered is proportionate to the relationship’s economics and complexity, not necessarily to reduce time spent with clients because some warrant a high level of service.
-
Net Profit Per Advisor
Net profit per advisor divides the firm’s net profit by its number of advisors. It shows how much profit the business generates, on average, for each advisor it employs. A rising figure may indicate that profit is growing faster than advisor headcount, while a falling figure may suggest that recruitment or operating costs are increasing faster than profit. It is a firm-level efficiency measure, not a direct measure of an individual advisor’s performance.
-
Net Profit Per Client
Net profit per client estimates the revenue a client relationship generates after deducting the costs attributable to serving it. It can help a firm identify whether different client segments and service models are economically sustainable, rather than assessing relationships on AUM or revenue alone. The measure depends on a consistent approach to attributing direct costs and allocating shared costs, such as compliance, technology and reporting, as well as advisor and support staff time where it cannot be assigned directly to a client. Otherwise, the metric might overstate client profitability.
-
Client Acquisition Cost (CAC)
CAC measures the average cost of winning a new client. This includes relevant marketing and business-development expenditures, as well as advisor and staff time. It helps a firm track the efficiency of its acquisition activity over time and channels. Measure CAC alongside the expected revenue and profitability of new clients, as relationships expected to generate greater long-term value may justify higher acquisition costs. Segmenting by acquisition channel and client type can show which sources lead to the most commercially valuable clients.
-
Operating Expense Ratio
Operating expense ratio measures a firm’s operating costs as a percentage of its total revenue. It shows how much the firm spends to generate each £1 of income. For example, a ratio of 70% means it costs £0.70 of every £1 of revenue to run the business before profit. Tracking the ratio over time shows whether costs are growing faster or more slowly than revenue. This can help management determine whether growth improves or weakens operating efficiency.
Software That Tracks and Measures Firm Performance
The KPIs above pull data from various places. Client and referral data may come from the firm’s wealth management CRM, AUM and performance data from its portfolio management system, and revenue and expenses from its accounting system. Calculating KPIs manually involves extracting data from each system, combining it and checking that the figures and reporting periods match. Repeating that process creates opportunities for data-entry and formula errors, inconsistent calculations and reporting delays.
Software that integrates those source systems can automate data collection and KPI calculations, reducing the manual work involved in assembling reports and helping standardise the definitions and calculations used each time. Some platforms can also use automated alerts to highlight unusual changes, such as a sudden rise in expense ratio or a fall in AUM per advisor, so managers can investigate them sooner. AI can automatically generate plain-language explanations of KPI movements using the underlying data. Those summaries can speed up review, but managers still need to check the underlying figures and investigate the reasons for material changes.
Centralise KPIs and Measure Growth Effectively with NetSuite
NetSuite ERP Software for Financial Services brings financial and operational data together on one platform. Its financial management, reporting and analytics capabilities provide a central source for information behind KPIs such as revenue, expenses and profitability. Firms can also connect external systems where relevant data sits elsewhere. Real-time dashboards can be personalised for different roles: A practice manager might focus on operational measures, while a finance director preparing a board report needs a different view of financial performance. Meanwhile, NetSuite’s AI capabilities can also identify anomalies in financial data and generate narrative commentary on changes in the figures. The underlying data remains available for users to review and verify before deciding whether a change requires action.
NetSuite ERP can also consolidate financial reporting for visibility throughout the organisation, including multiple offices and entities, subsidiaries and currencies. This gives a growing firm a consistent basis for comparing performance throughout the business without maintaining separate reporting structures for each entity.
NetSuite ERP Software for Financial Services
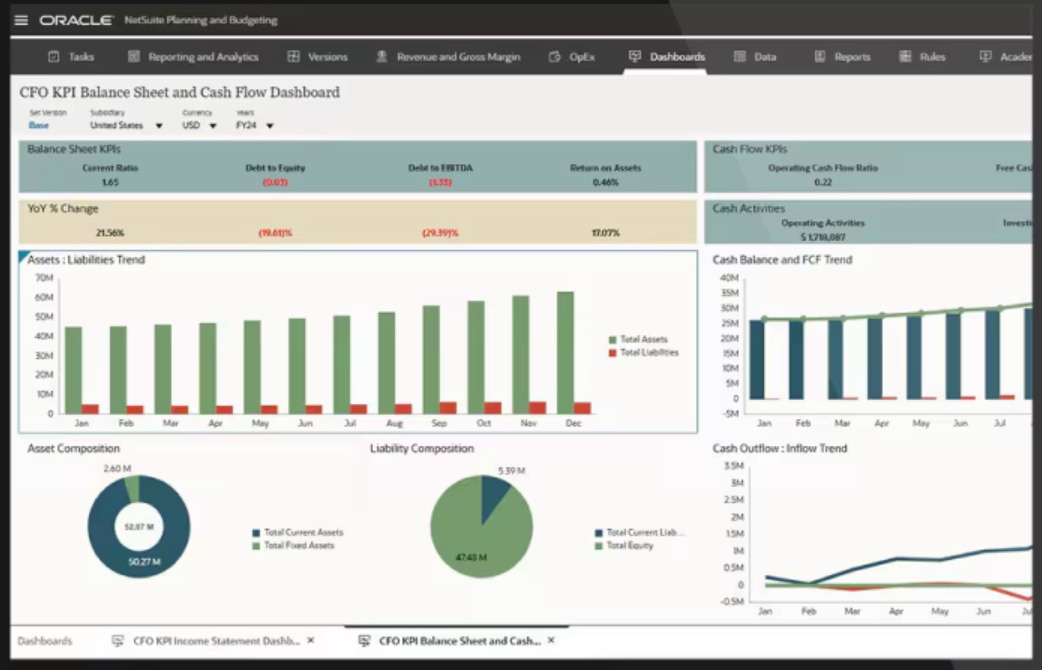
The most useful KPIs are the ones that give management a clear view of how the firm is performing against its priorities. Some will show growth, others profitability, client relationships or operational capacity. What matters is defining what each KPI is intended to measure, who is responsible for it and when it will be reviewed. That gives management a consistent basis for identifying changes in performance and deciding where further investigation or action is needed.
See how NetSuite ERP benefits the Financial Services sector here. (opens in new tab)
Wealth Management KPIs FAQs
Which software helps track wealth management KPIs?
CRM, portfolio management and financial management software systems each track a piece of the picture, covering client data, assets under management (AUM) and performance and revenue and cost data respectively. Firms get the most accurate, current KPIs when these systems share data automatically instead of relying on manual exports and spreadsheets. An ERP system can support this, but it is not the only way to connect data sources.
Which KPIs are required for FCA compliance?
The FCA doesn’t prescribe a single list of KPIs. However, firms within the Consumer Duty scope need appropriate management information to monitor and document whether retail customers receive good outcomes from products and services, price and value, consumer understanding and consumer support. The measures must relate to the firm’s business model, products and customers, and help identify and address poor outcomes.