
For most restaurants, margins are thin. Full-service establishments in the UK typically run on net margins of just 3–5%, leaving little room for error. Menu design is one of the few levers operators can pull without major capital investment, and research confirms it directly influences customer choices. Yet while 70% of restaurant leaders consider menu optimisation as fundamental to their goals, only 27% apply rigorous analysis before making changes. Menu engineering is a systematic way to close that gap.
What Is Menu Engineering?
Menu engineering is a systematic process for using sales data, food costs and contribution margins to guide ongoing decisions about menu pricing, design and composition. The goal is to steer customers toward dishes that are both popular and profitable — and to rethink or remove the ones that aren’t.
Key Takeaways
- Menu engineering is an ongoing process that uses sales data, food costs and contribution margins to design restaurant menus that maximise profit.
- The four-quadrant matrix — Stars, Puzzles, Plow Horses and Dogs — categorises dishes by popularity and profitability, guiding decisions about what to promote, rework or cut.
- Contribution margin (selling price minus food cost) matters more than food costs alone, because it shows actual profit per dish.
- Data reveals what to promote, while design techniques such as strategic placement, descriptive language and visual cues influence how customers respond.
- POS systems and integrated software make the analysis faster and more accurate, turning menu engineering from a periodic project into a regular discipline.
Menu Engineering Explained
Menu engineering originated in 1982 when hospitality researchers Michael Kasavana and Donald Smith published Menu Engineering: A Practical Guide to Menu Analysis. Their core insight was that food cost percentage alone doesn’t determine profitability; a dish with a higher food cost can still generate more profit if its contribution margin is larger. They suggested that restaurants could be more successful by determining their most profitable dishes and then designing their menus to promote those dishes.
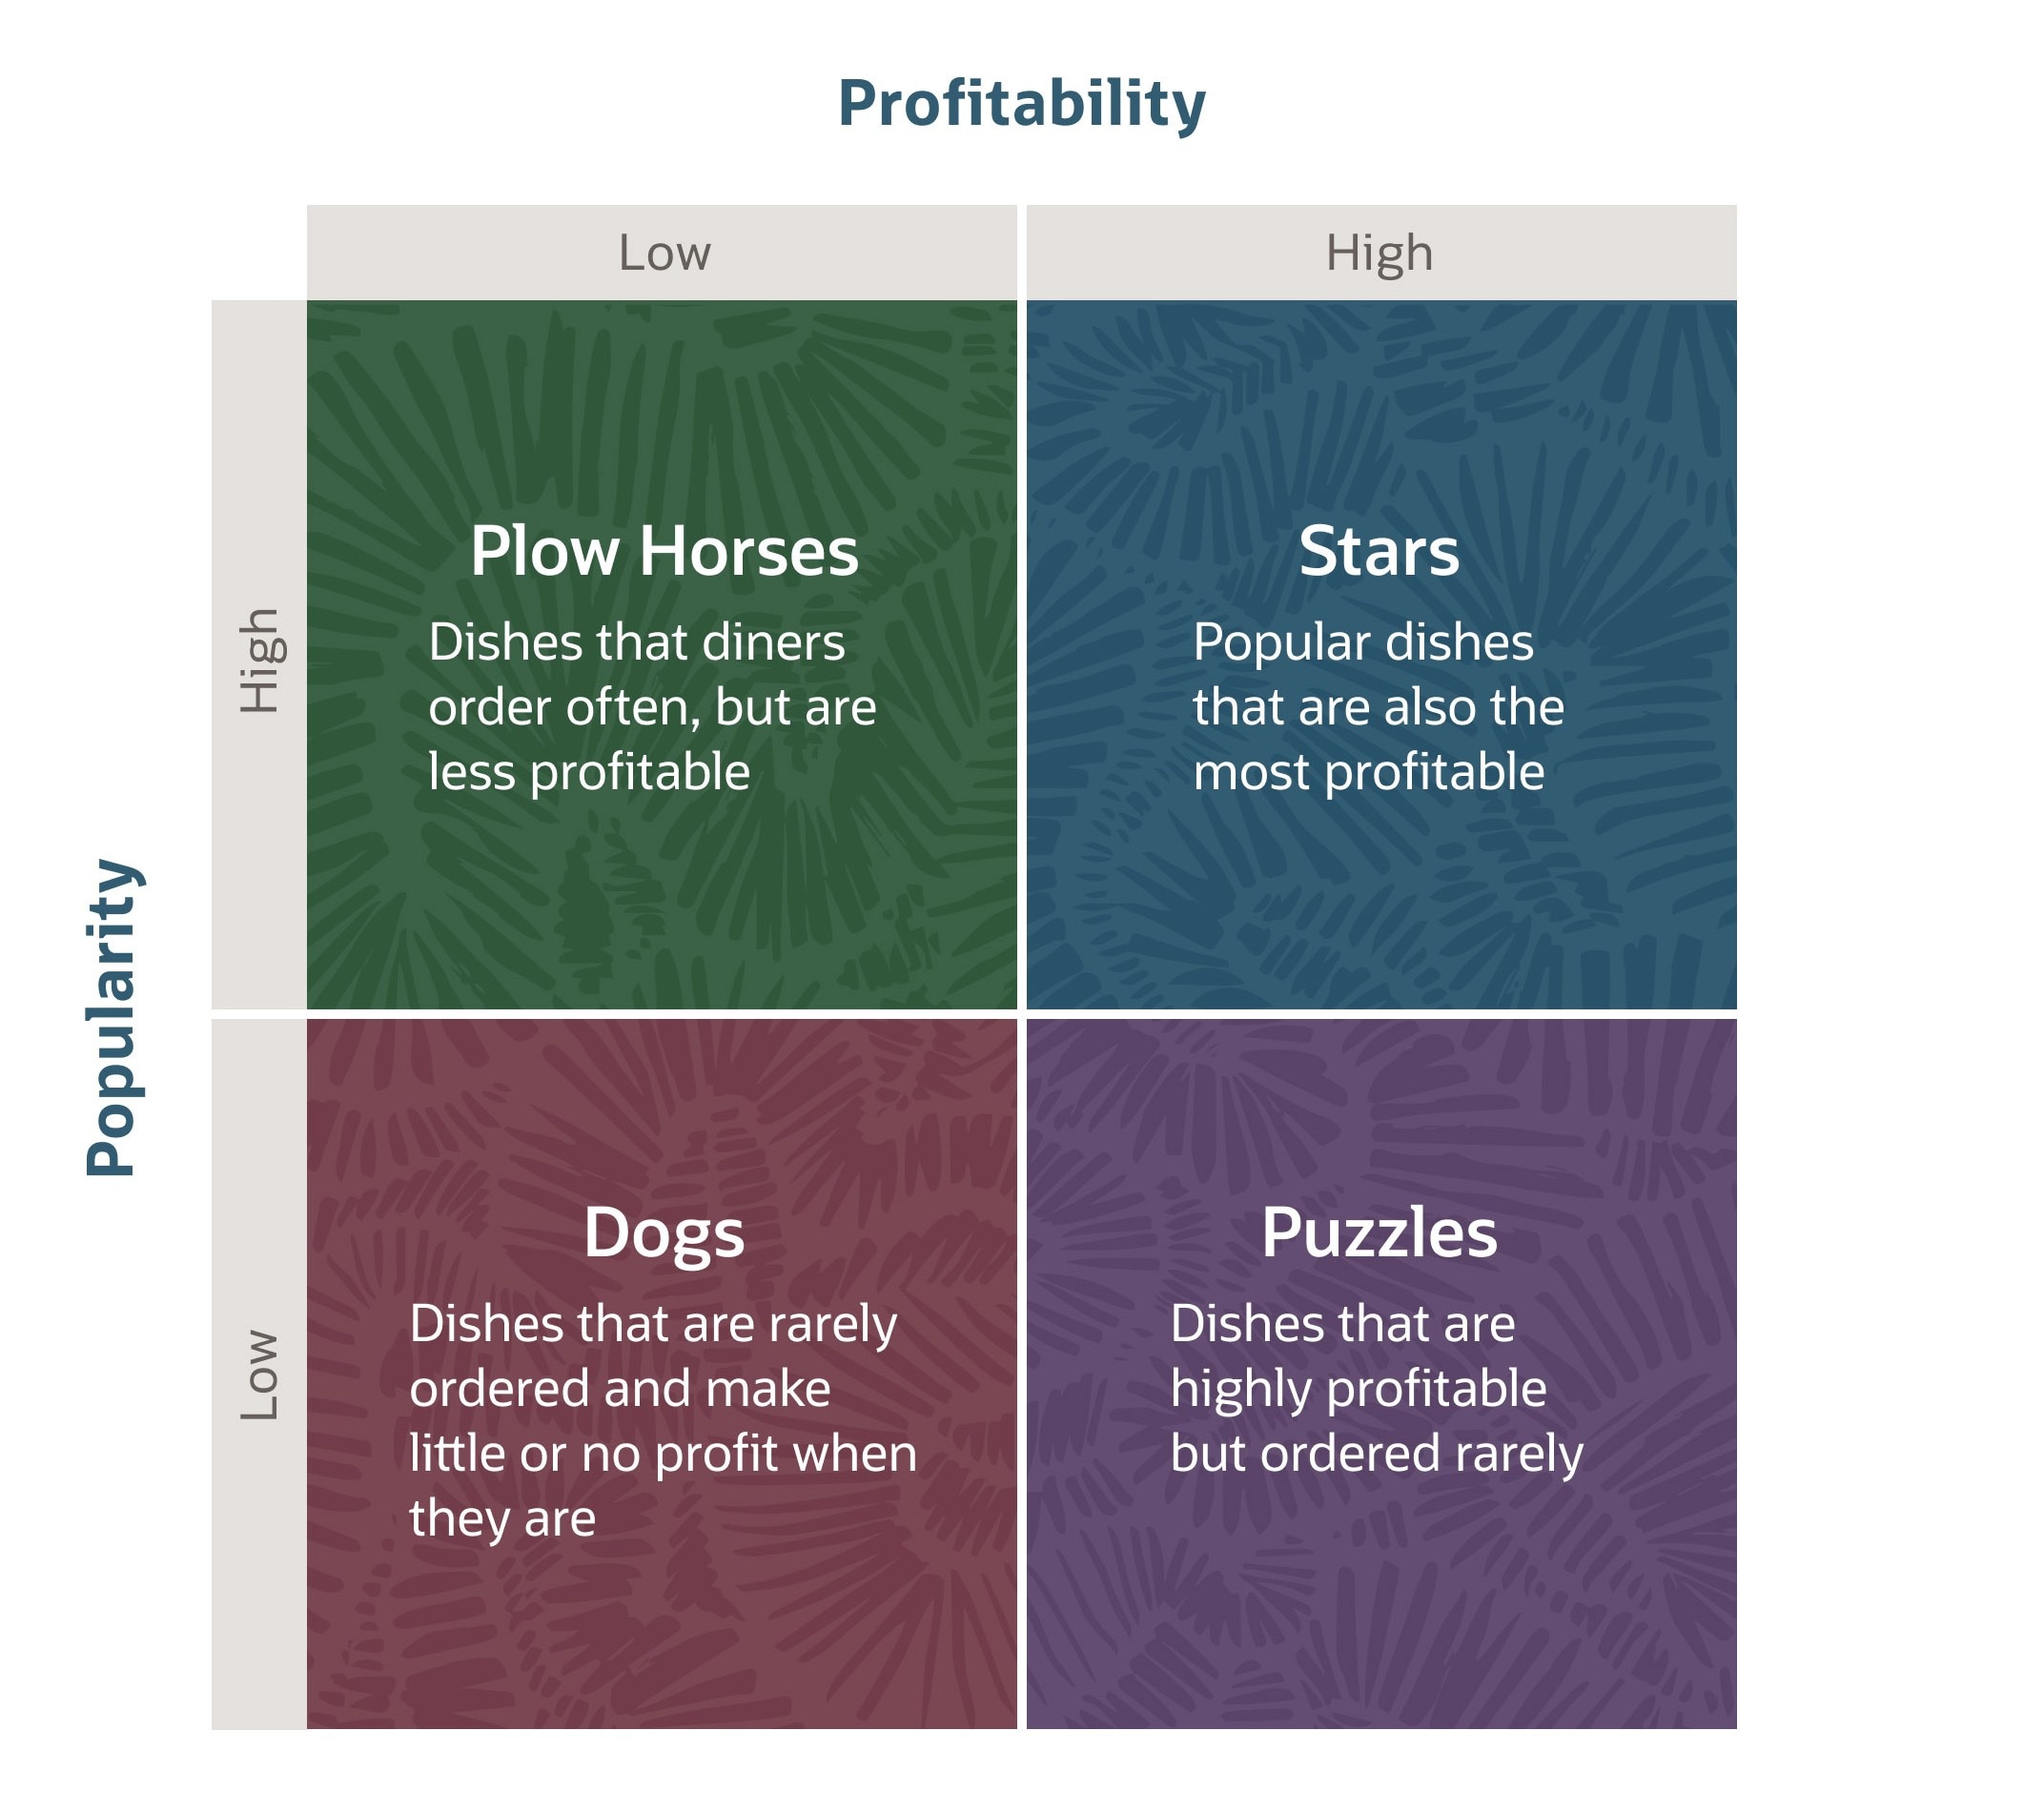
To help with the process, Kasavana and Smith adapted a corporate strategy framework to restaurant menus, plotting every dish on two axes: popularity (how often it sells) and profitability (how much it contributes to the bottom line). The result is four quadrants, named “Stars”, “Plow Horses”, “Puzzles” and “Dogs”, with each calling for a different strategic response. Analysis is most accurate when restaurant owners create multiple matrices, so they can compare like for like: mains to mains, desserts to desserts. Some operators go further, running separate analyses for lunch and dinner menus, since the same dish can perform differently depending on daypart.
The Four Quadrants of Menu Engineering
The four quadrants of menu engineering classify every dish on a menu based on popularity and profitability. Each quadrant signals what action to take, such as promoting the item, reducing its portion size, adjusting menu pricing or even removing it from the menu altogether.
Menu Engineering Matrix
Stars
Stars are both popular and profitable. Customers order them often, and each sale generates strong margins. These are the dishes to protect by maintaining quality and consistency. In other words, don’t tinker with what’s working. Stars should be featured prominently on the menu.
Puzzles
Puzzles are profitable, but diners rarely order them. The challenge is to diagnose why. Are they poorly positioned on the menu? Do descriptions fall flat? Are they seen as overpriced? Changes to placement, language or pricing can sometimes unlock a Puzzle’s potential.
Plow Horses
Plow Horses are dishes that customers love but yield thin margins. For dishes in this quadrant, the goal is to improve profitability without sacrificing what makes them popular. Options include modest price increases, portion adjustments, recipe modifications with lower-cost ingredients, or pairing them with higher-margin sides and drinks.
Dogs
Dogs are neither popular nor profitable. They occupy menu space, complicate inventory and distract from stronger performers. In most cases, the right move is to drop them from the menu. However, it’s important to consider context before cutting them, as some Dogs serve a purpose. A children’s menu item, for example, may not sell often or carry high margins, but it keeps families coming back.
Menu Engineering Step-by-Step
The four-quadrant menu engineering framework is only as useful as the data behind it. The following steps outline how to gather that data, run the calculations and apply the results.
-
Select Your Date Range for Menu Analysis
Start by choosing a time period to analyse. The range needs to be long enough to produce meaningful sales data — typically a few weeks to a few months — but not so long that conditions have shifted significantly since the start. Restaurants with seasonal menus often align their analysis with menu changeovers, while those with stable menus conduct reviews quarterly or biannually.
-
Perform Your Calculations
To plot dishes on the matrix, you need two data points for each item: popularity and profitability. Popularity is straightforward: how many times each dish sold during your chosen time period. Restaurants with a POS system can extract those numbers easily; those without will need to track the numbers manually.
In menu engineering, profitability is measured by contribution margin, or selling price minus food cost. Before calculating it, you’ll need to know the food cost for each dish.
Menu-Item Food Cost
Food cost is the total out-of-pocket for the ingredients needed to make one serving of a dish. To calculate it, list every ingredient — including seasonings, garnishes and cooking oil — and determine the cost of the quantity used.
Here’s a menu-item food cost breakdown using fish and chips as an example.
Ingredient Details Cod fillet 170 g — £2.40 Potatoes 200 g — £0.35 Batter (flour, egg, beer) 1 portion — £0.15 Peas 60 g — £0.20 Tartare sauce 30 g — £0.15 Frying oil (per portion) — — £0.25 Lemon wedge 1 — £0.10 Total Food Cost £3.60 Menu-item food cost focuses on ingredient costs, not labour. Labour is typically treated as overhead because staffing costs don’t change based on which dishes are ordered.
Once you know the food cost, you can express it as a percentage of the selling price. Food cost percentage is useful for checking whether pricing makes sense and for spotting when ingredient costs have crept up. Here’s the formula:
Food cost percentage = (Food cost / Selling price) × 100
If the restaurant sells fish and chips for £14.50, its food cost percentage would be 24.8%, or (£3.60 / £14.50) × 100. Industry benchmarks typically target 28–32% or lower, putting this dish comfortably under that ceiling. This means the company is spending less on ingredients relative to what it’s charging, but it doesn’t tell you how much profit the dish generates.
Contribution Margin
Contribution margin is the amount each sale contributes toward covering labour, overhead and profit. This is the metric that determines where a dish lands on the matrix.
Contribution margin = Selling price − Food cost
For the fish and chips example, the contribution margin is £10.90 (£14.50 − £3.60).
-
Categorise Menu Items into One of the Four Quadrants
With sales numbers and contribution margins calculated for each dish, the next step is to plot them on the matrix. This requires establishing two thresholds: one for profitability, one for popularity.
Profitability threshold: Calculate the average contribution margin across all items in the category you’re analysing (e.g., all mains or all appetizers). Dishes above the average are considered high-profit; those below are low-profit.
Popularity threshold: Calculate each dish’s share of total sales in its category, then compare it to a baseline. The baseline is what each dish’s share would be if sales were evenly split. For example, if you have 10 mains, even distribution would mean each accounts for 10% of sales. But sales are never even, so the standard methodology sets the threshold at 70% of that figure; in this case, 7%. Any dish with a 7% or higher share of sales is considered “popular.”
Once thresholds are set, plot each dish:
Low Profit High Profit Above Popularity Threshold Plow Horse Star Below Popularity Threshold Dog Puzzle The result is a clear picture of which dishes are earning their place on the menu and which need attention.
For example, a restaurant has four dessert options. After calculating contribution margins for each, the average is £4.50. The popularity threshold is 17.5% (4 items = 25% each if evenly split; 70% of 25% = 17.5%).
- Sticky toffee pudding has a contribution margin of £5.20 and accounts for 30% of dessert sales. Because it’s above average on both measures, it’s considered a Star.
- Crème brûlée has a contribution margin of £5.80 but accounts for only 12% of sales. It’s profitable but falls below the popularity threshold, making it a Puzzle.
- The chocolate torte has a contribution margin of £3.80 yet accounts for 35% of sales. Its status as popular but low margin means it’s a Plow Horse.
- Fruit salad has a contribution margin of £3.20 and accounts for 10% of sales. Since it’s below average on both measures, it’s marked as a Dog.
-
Use Insights to Redesign Menu
The value of the matrix comes from acting on the insights it yields. Begin with the easy fixes: Dogs that should be cut, or Puzzles that have potential to become Stars.
Then focus on changes with compounding returns. To convert a Puzzle into a Star, experiment where it sits on the menu, rewrite its description or adjust the price. To improve a Plow Horse’s margin, consider a modest price increase, a slightly smaller portion or swapping in a lower-cost ingredient without compromising what makes the dish popular.
Before overhauling the entire menu, test changes as specials or limited-time offers. Track how adjustments affect both sales volume and contribution margin. If a Puzzle starts selling after a price drop, for example, confirm that the new margin justifies keeping it around. Digital menus are useful here because they can be updated instantly. This makes them ideal for testing placement, descriptions and pricing. That said, don’t overdo it. Customers may notice when menus change too frequently or when a favourite dish moves or disappears. The goal is refinement, not constant reinvention.
Menu engineering works best as an ongoing cycle. Run these analyses quarterly or when costs shift significantly, compare results to the previous round and adjust. Over time, patterns are likely to emerge — which changes stick, which don’t — making it easier to hone with each iteration.
Advantages of Menu Engineering
Restaurants that apply menu engineering consistently tend to see benefits in several areas.
- Enhanced profitability: By promoting the dishes that generate the strongest contribution margins, menu engineering shifts the sales mix towards higher-profit items. Even modest shifts in what customers order can meaningfully improve margins over time.
- Optimised menu design: Dishes that should sell well but don’t may be buried in the wrong spot or undermined by weak descriptions. Menu engineering provides the data to fix those problems rather than relying on guesswork.
- Improved cost control: Menu engineering requires calculating food costs for each dish, which exposes cost creep that might otherwise go unnoticed — such as a supplier price increase or drifting portion sizes. Once visible, these issues can be addressed through recipe tweaks, portion adjustments or supplier negotiations.
- Higher customer satisfaction: A well-engineered menu is easier for diners to navigate than a cluttered one. Fewer low-performing dishes means less decision fatigue. And by highlighting popular, well-executed dishes, restaurants increase the odds that customers leave happy and come back.
What Is Menu Psychology?
Diners make a series of small decisions during a meal: what to order, whether to add a starter, which price point feels comfortable, whether dessert is worth it. These choices can be influenced by factors they’re not consciously aware of; where their eyes land first, how a dish is described, what’s positioned next to it, how the price is displayed. Menu psychology is the study of these influences and the application of behavioural principles to menu design.
Combining Menu Psychology and Menu Engineering Strategies
Menu engineering and menu psychology work best together: Engineering identifies the dishes worth promoting, and psychology provides the tools to make that promotion effective.
Core techniques include strategic placement of high-margin items in visual “hot spots” (such as the top right of a menu or first and last items in a list), pricing presentation that reduces the focus on price (such as omitting currency symbols) and design cues (boxes, icons, colour or white space) that draw the eye to specific items.
12 Tips for Engineering a More Profitable Menu
The matrix tells you which dishes to focus on. The following tips cover what to do next, from cutting underperformers to using psychology-informed design to nudge customers toward higher-margin choices.
-
Eliminate under-performers. Dogs take up menu space without contributing much profit or drawing customers. They can also add complexity to inventory if they require ingredients that nothing else on the menu uses. If a dish lands in that quadrant consistently, consider cutting it — though context matters. A vegan item, for example, may justify its spot even with weak numbers.
-
Test different portion sizes and price points. A Plow Horse with thin margins might become a Star if portions were slightly smaller or the price was slightly higher. Before making a permanent change, test adjustments to find the balance that protects both profitability and customer satisfaction.
-
Rewrite menu descriptions. Specific, sensory language sells better than generic labels. “Slow-roasted lamb shoulder with rosemary jus and buttered seasonal greens” outperforms “lamb with vegetables”. Focus description efforts on Puzzles, where better language may boost orders, and Stars, where strong descriptions reinforce their appeal. Plow Horses already sell well, and Dogs are better candidates for removal than reinvention.
-
Use menu psychology techniques. Decoy pricing places a higher-priced item near a dish you want to promote, making the target — typically a high-margin Star or Puzzle — feel like better value. Removing currency symbols or trailing zeros can also soften price sensitivity. These subtle cues can influence ordering behaviour without customers realising it.
-
Optimise recipes for better ingredient utilisation. If a Star uses an ingredient that nothing else on the menu requires, that’s a risk — waste goes up if demand fluctuates. Where possible, design recipes so key ingredients appear in multiple dishes.
-
Keep up with dining trends. Diner preferences shift. Plant-based options, low-waste cooking and global flavours have all moved from niche to mainstream in recent years. A menu that ignores food and beverage trends risks being seen as passé.
-
Use visual cues. Research suggests warm colours such as red, orange and yellow can stimulate appetites. Boxes, icons and whitespace placed strategically can draw attention to high-margin items. Although photos are invaluable for online menus, they’re less effective on printed menus, especially if the photography is poor. Regardless of the tool, exercise restraint. If everything is highlighted, nothing stands out.
-
Be wary of analysis paralysis. Don’t let the pursuit of perfect information delay opportunities to make changes. A “good enough” decision made now often beats a slightly better decision made too late.
-
Optimise menu layout and organisation. Group items logically and limit choices per category to avoid overwhelming diners. Menu format matters: according to noted menu engineer Gregg Rapp — a Hospitality Hall of Fame inductee — two-panel menus tend to perform best. One-panel menus lead to faster decisions but lower spending, while three or more panels dilute focus. Place high-margin dishes where they’re easy to find, but test what works for your format rather than relying on generic rules about eye movement.
-
Try limiting dining hours. If lunch service consistently underperforms, the labour and operational costs may not justify keeping it. Focusing on profitable dayparts can improve overall margins.
-
Test menu items with specials or limited time offers. Before adding a new dish permanently, test it as a special. Track both sales and contribution margin to see whether it earns a permanent spot.
-
Re-evaluate regularly. Menu engineering isn’t a one-off project. Ingredient costs change, customer preferences evolve and competitors adjust. Build periodic reviews into operations so the menu stays aligned with business goals. And don’t rely solely on the numbers; talk to front-of-house staff. They hear why customers hesitate, which dishes prompt questions and what gets sent back. That qualitative feedback often explains what data alone can’t.
Uncover Financial Insights with NetSuite
Menu engineering only works when the data is trustworthy and timely. NetSuite Accounting Software for Restaurants unifies EPOS sales, recipe costs, wastage and delivery-channel fees directly with finance, so dish-level contribution margins, COGS and sales mix update automatically by site and daypart without spreadsheets or version drift. Automated VAT for eat-in vs. Takeaway and MTD filing to HMRC reduce compliance effort while keeping records audit-ready. With integrated inventory tracking, food cost data stays current without manual updates. Role-based dashboards make it easy to monitor menu performance at a glance, and planning and budgeting tools help model the impact of pricing or portion changes before committing to them.
Go from static reports to actionable insight with NetSuite Financial Management which provides real-time visibility into financial performance of restaurants, from consolidated reporting down to individual transactions.
Menu engineering gives restaurant operators a structured way to make informed decisions about one of their most important assets. The framework isn’t complicated: categorise dishes by popularity and profitability, then act on what the data reveals. But the real value comes from repetition. Ingredient costs shift, customer preferences change and competitors adjust — which means a menu optimised once and forgotten quickly becomes outdated. Restaurants that build menu engineering into their regular operations are the ones whose menus stay sharp and profitable.
Menu Engineering FAQs
What is the difference between menu planning and menu engineering?
Menu planning focuses on what dishes to offer; considering cuisine, seasonality, variety and customer preferences. Menu engineering analyses how those dishes perform financially and uses the data to optimise pricing, placement and promotion. Planning decides what's on the menu; engineering decides how to make the menu more profitable.
What are the primary goals of menu engineering?
The primary goals are to increase profitability by promoting high-margin dishes, identify underperformers that should be cut or reworked and optimise menu design to influence customer choices toward items that benefit the business.
What is the formula for menu engineering?
The key formula is contribution margin, which is calculated by subtracting an item’s food cost from its selling price. Food cost is the total spent on ingredients for one serving, and selling price is what the customer pays. The result is the profit each dish contributes towards covering labour, overhead and margin. It plays a role in determining where each item lands on the menu engineering matrix (alongside popularity). The formula is: Contribution Margin = Selling price − Food cost.
What are the three elements of menu engineering?
Three core elements include profitability analysis (calculating contribution margins for each dish), popularity analysis (tracking sales volume) and menu design (using placement, descriptions and visual cues to promote high-performing items).